Our hydro generation stations are a key element of our renewable portfolio, contributing 220MW of installed clean energy to Ireland’s electricity system.
We own and manage five hydro stations across the country, on the Rivers Shannon, Lee, Liffey, Erne and Clady. Each of our hydro stations is unique and their actions during floods or drought reflects the multiple uses which their reservoirs serve whether that is hydropower, drinking water supply, navigation, recreation or flood alleviation.
River Lee
Our Lee hydro stations at Carrigadrohid and Inniscarra produced 91,350 MWh of clean energy in 2023, well above the long-term average (LTA) of 75,000MWh.
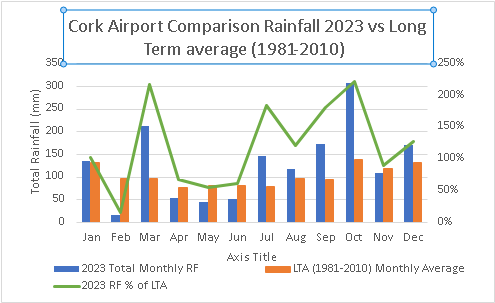
The River Lee catchment recorded an annual rainfall total of 1527.3mm. This was 24% greater than the LTA with the wettest month being October, when significant flooding was experienced in Co Cork.
The estimated peak inflow into the Lee Station reservoirs was under 300m3/s (tonnes of water per second) at around midday on December 27th. This was slightly higher than the peak inflow during Storm Babet recorded in the previous October. Peak discharge from Inniscarra was 148m3/s, recorded on 21st October. Use of the reservoir storage during Storm Babet prevented a higher discharge in that case but heavier or longer rainfall events will necessitate higher discharges. More information here.
River Liffey
Our Liffey stations at Poulaphouca, Golden Falls and Leixlip produced 28,200 MWh of clean energy in 2023 which was above the LTA of 26,300MWh.
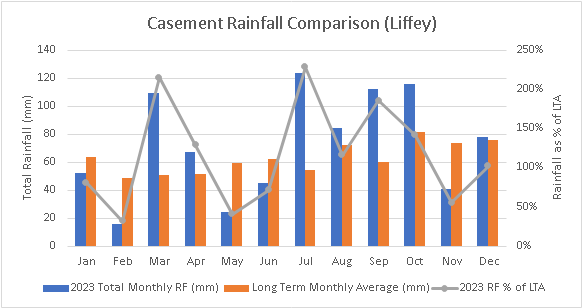
The rainfall at our Liffey stations was 15% greater than the LTA with the wettest months being July, October, and September. Indeed, the rainfall in July was 229% of its monthly LTA.
The rain associated with an Orange rainfall warning on October 20th and the heavy rain on December 27th caused the largest inflows into Blessington reservoir with the level rising in each case by almost 0.5m in 24 hours. High discharges were not required during those specific events, but the storage in the reservoir could have been used up had the rain continued to fall.
River Erne
Our Erne stations cover two locations at Cliff and Cathleen’s Fall – using the natural drop of 45m over the two to form the basis for the second-largest hydro operation in the country.
More than 360,000 MWh of zero-carbon energy was produced at our Erne stations in 2023, well above the LTA of 295,700MWh. The rainfall across the Erne catchment was 1293mm, 24% above long-term average of 1041mm. February was the driest month and July was the wettest with no flooding reported in the catchment during the year. Due to the flows out of Lough Erne, our Cliff station was required to discharge water through its spillway gates for almost 440 hours in 2023.
River Shannon
Although production at our Ardnacrusha station was lower than planned in 2023 due to extended maintenance on one of our turbines, the very wet weather led to the station producing 389,700 MWh of clean energy compared to the LTA of 340,000MWh.
Lough Allen
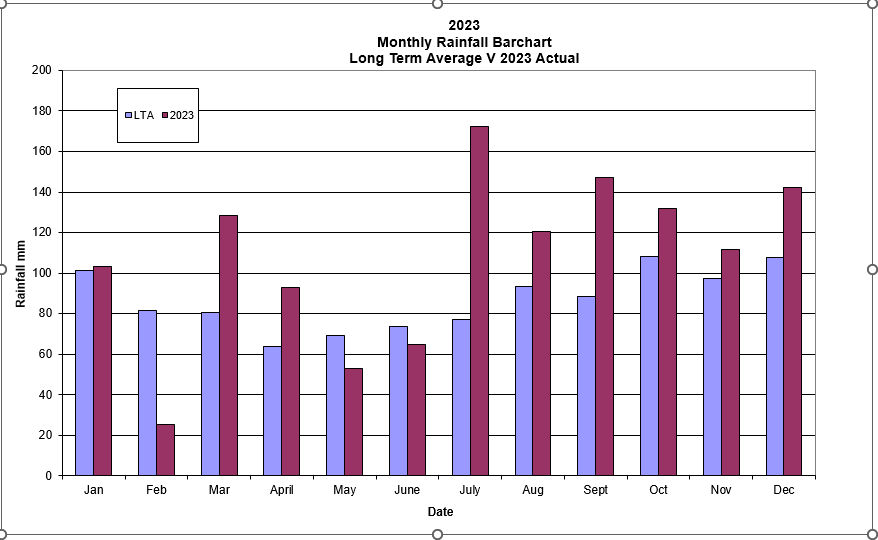
The yearly rainfall total was 1604.5mm, 23% greater than the LTA with the wettest month being July. The peak level there was 49.91mOD on December 31st. The level did not exceed the median flood level of 50.18mOD during the year.
Lough Ree
The yearly rainfall total was 1337.1mm, 28% greater than the LTA with the wettest month being July (282% of monthly LTA). Significant flooding occurred in the Callows region resulting from this rainfall.
The peak level on Lough Ree was 38.85mOD on January 17th,18cm above the median flood level of 38.67mOD, but well below the highest experienced floods on record.
Lough Derg
The yearly rainfall total was 1080.2mm, 14% greater than the LTA.
The peak level was 33.99mOD on January 15th, 22cm above the median flood level of 33.77mOD, but well below the highest experienced floods on record.
All our hydrometric information is available to view here.